

Technical Analysis
Technical analysis is the art of identifying patterns in the price movement of any security, such as forex, using historical trading data. Forex Analysing Made Easy
Identifying these key patterns can help us understand where to buy and sell at given times. Technical analysis is a tool heavily used by many short to medium term traders, especially when there is little development in the market. Most market commentary and analyst picks use technical analysis incorporated with fundamental analysis.
Why Is It Used?
Technical analysis is used by nearly all traders at different scales and intensities. As a result, most technical movements are self-fulfilling as the market reacts according to the patterns.
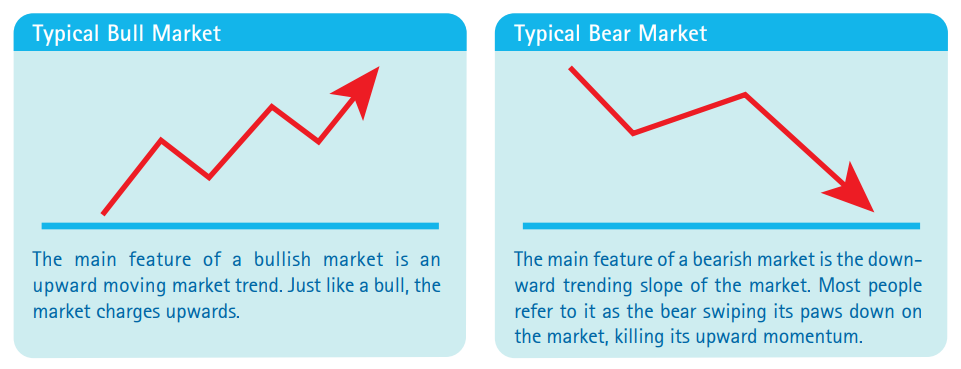
The Two Basic Chart Movements
To start with the basics, there are two types of chart movements in the markets. These are called Bull and Bear markets.
| Fundamental analysis is the study of the intrinsic value of an investment. In forex, it entails looking at the economic conditions that affect the valuation of a nation’s currency. The 4 major reports you can look at are: 1. Gross Domestic Product 2. Retail Sales 3. Industrial Production Index 4. Consumer Price Index |
More Read

Charts
With technical analysis, you will be constantly looking at charts to try and identify key patterns and market movements, so it helps to know what chart might best suit you. Below are a few key chart types and their practicalities.
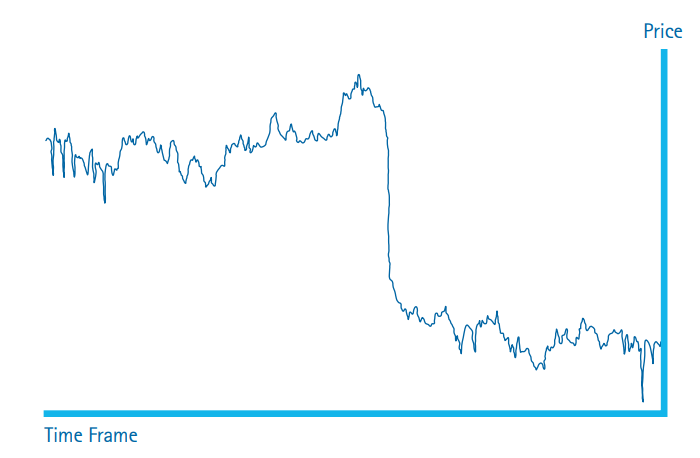
1. Line Chart
A line chart is the most basic of the charts; it is a line which plots the closing price of the chart during a period as it moves up and down in the market. It is simple and easy to use, and great for identifying trends in the markets. But it is not a popular type of chart among traders as it only shows a fraction of the big picture compared to other styles.
| When trying to figure out the best trading strategy for the markets, always remember that the trend is your friend. A common mistake traders make is going against the trend or alternatively, trying to time the trend. |
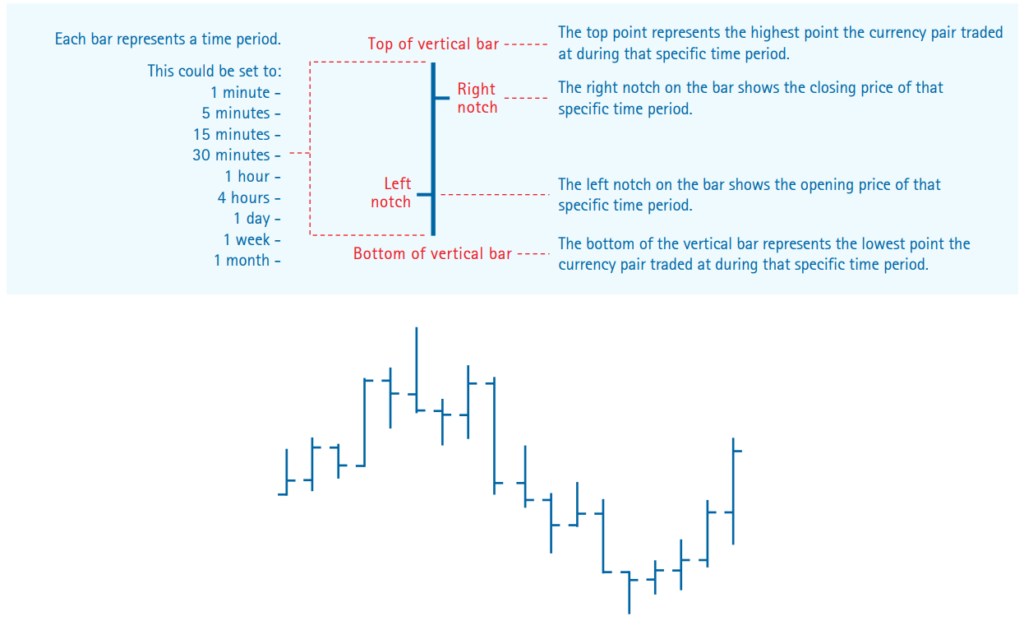
2. Bar Chart
A bar chart has vertical bars that show the open, high, low and close points for the selected time period.
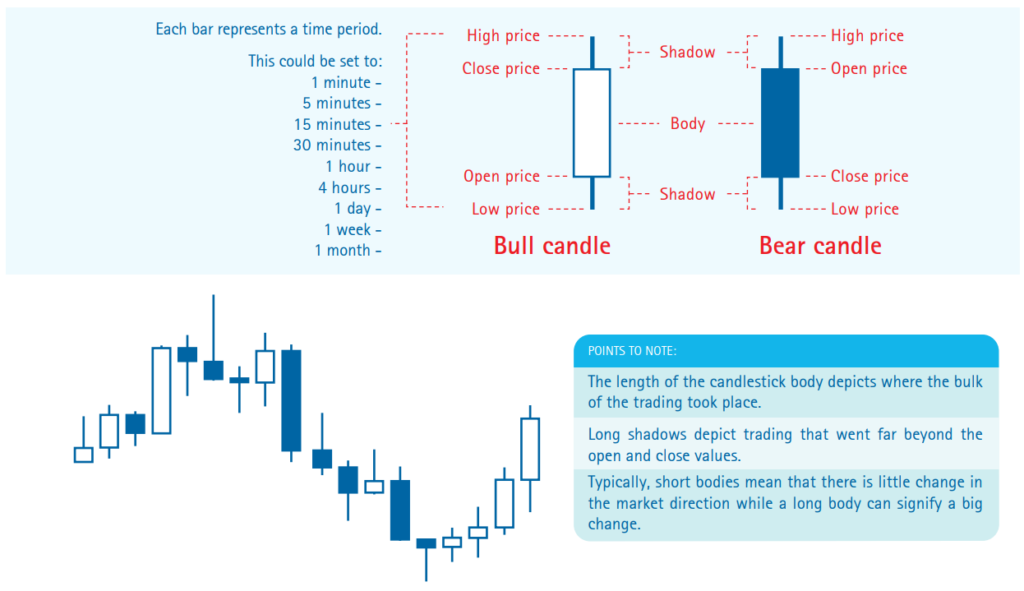
3. Candlestick Chart
Candlestick charts are the most common when it comes to forex trading. Originating from Japan, this chart has since stormed the FX world and is now the most popular chart for traders to use. It is the easiest chart on which to see trends as well as find patterns in the candlestick shapes which other charts are unable to show. Usually, bull candles (uptrends) are white, while bear candles (downtrends) are black or coloured.
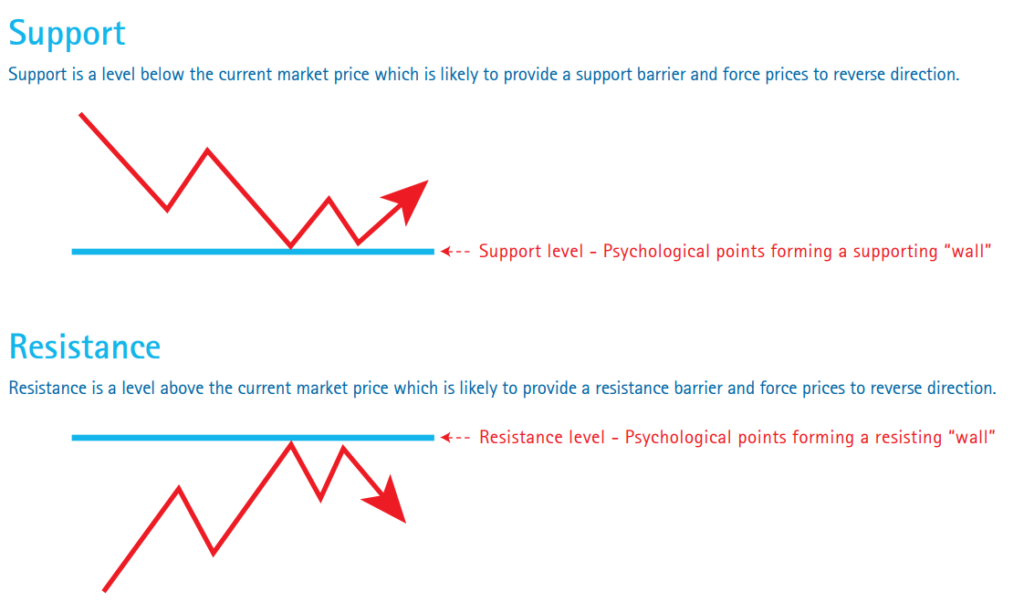
Support and Resistance
Support and resistance are the psychological points where price will hit “walls” in the market, causing the trend to reverse direction. These points are identified from past data where the market has hit a certain price level previously and reversed direction.
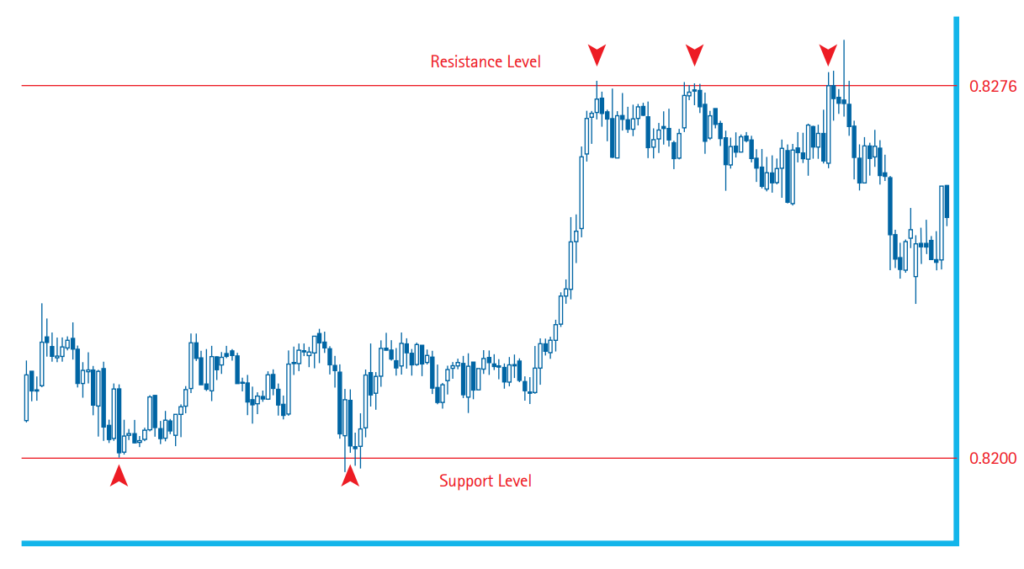
Support and resistance levels can be identified by two or more turning points in the market on the same horizontal price level.
EXAMPLE
Looking at the graph below, we can see a support level formed at the 0.8200 cent mark, while at 0.8276 a resistance level has formed.
Support and resistance levels are the most common and one of the best tools a trader can use to help set stop loss and take profit orders – the more times the price touches and reverses from the support or resistance level, the stronger the support or resistance. Once a support level is broken however, it will often become a resistance level and vice versa, as resistance levels become support levels after broken.
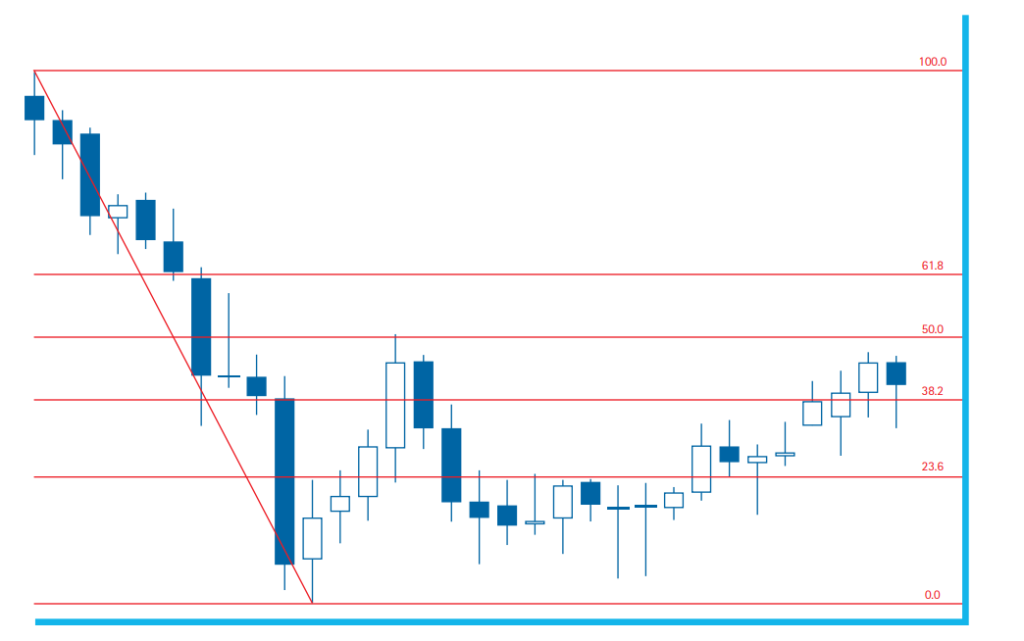
Fibonacci Retracement
Fibonacci retracement is a popular tool in technical analysis based on key numbers identified by Leonardo Fibonacci back in the thirteenth century and refers to areas of support and resistance. The Fibonacci retracement is the potential retracement of a financial asset’s original move in price.
Fibonacci retracements use horizontal lines to indicate areas of support or resistance at the key Fibonacci levels before it continues in the original direction. These levels are created by drawing a trendline between two extreme points and then dividing the vertical distance by the key Fibonacci ratios of 23.6%, 38.2%, 50%, 61.8% and 100%. These ratios are nicknamed the “golden mean”.
Fibonacci retracement is the second most common tool after support and resistance levels. It plays an important role in technical indicators, providing us with potential support and resistance levels in the markets which traders abide by. It is important to be aware of these levels so that you can use them to your advantage.
Reversal Patterns
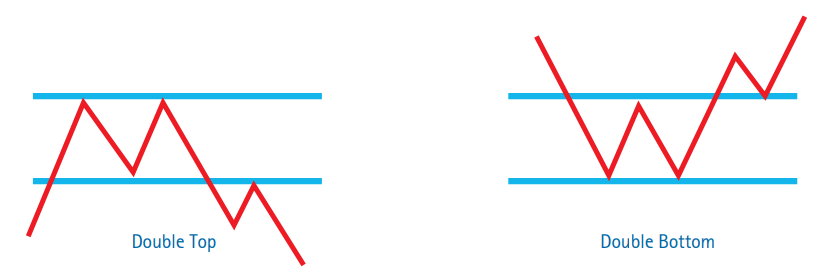
1. Double Top and Double Bottom
Double top and double bottom patterns are reversal patterns signifying that the end to the current bullish or bearish trend is near. They are identified by two consecutive peaks of around the same price level. Between these peaks is called the “valley”, and the lowest (or highest in a double bottom) price that the “valley” hits is called the “neck line”. The double top or double bottom is confirmed once the price falls (or rises in a double bottom) through the neck line
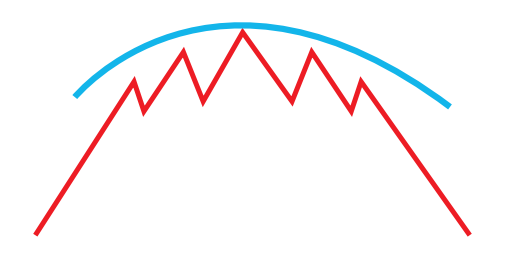
2. Rounding Top and Rounding Bottom
Rounding tops and bottoms are also reversal patterns that are seen when investor sentiment slowly shifts from bullish to bearish or vice versa. During the peak of the rounding top, volume drops off due to indecisiveness in the markets, but gradually picks up again as the reversal is confirmed. The further the market moves in reverse, the more accelerated the price movement becomes
Continuation Patterns
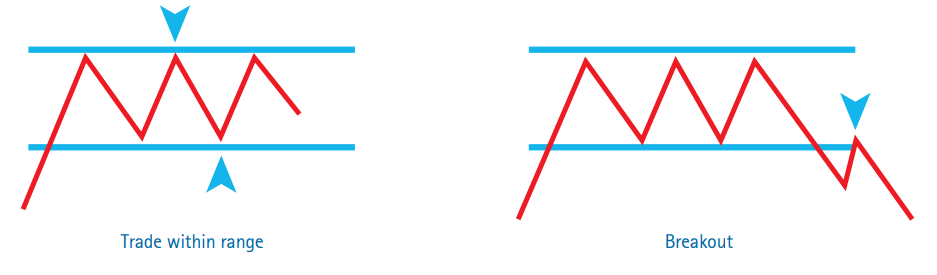
1. Rectangles
Consolidation patterns are useful tools in identifying trend patterns in the markets, especially in the short to medium term. A consolidation pattern forms when the market has lost direction and is unsure where it wants to go. At this point, the market just bounces between support and resistance levels. You can only identify a direction when the market breaks out of its range. These patterns are confirmed when three or more points touch common support and resistance levels
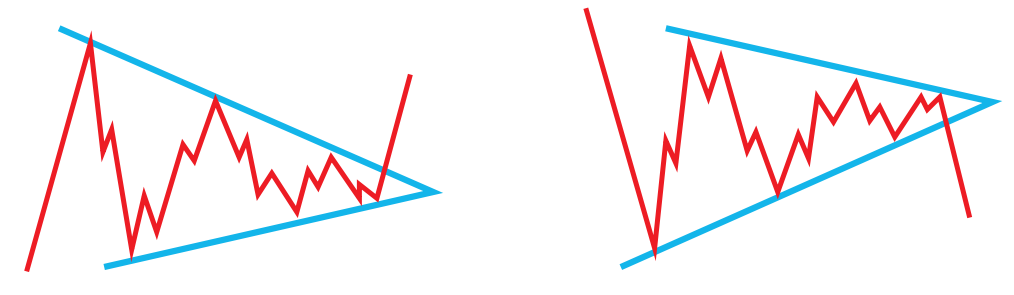
2. Triangles – Symmetrical
A symmetrical triangle is a continuation pattern that signals a period of consolidation. It is formed by the converging of a descending trend line and a rising trend line. The two sloping lines should have a converging point forming a triangle. The price of the pair will bounce between the two lines before breaking out as it reaches the tip of the triangle.
Consolidation Patterns
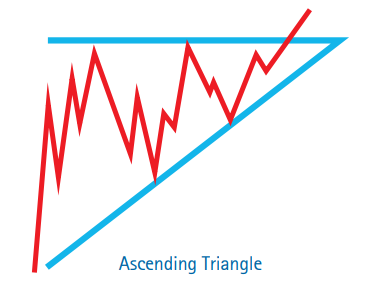
1. Triangles – Ascending
An ascending triangle is bullish, the pattern forms from a flat trend line being a point of resistance and an upward sloping trending acting as support. The price bounces between the two lines before breaking out upwards, and continuing its bullish run. If it fails to break through on an ascending triangle, the price will look to make a higher low than before as it falls and breaks the pattern.
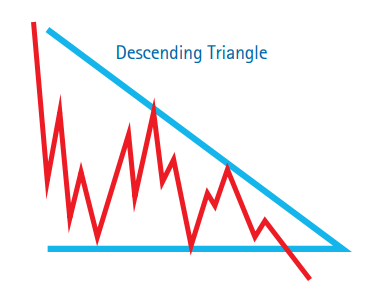
2. Triangles – Descending
A descending triangle is normally a bearish signal in the market, it involves a horizontal line on the support level with a descending line on the resistance points. The price bounces between the two just like an ascending channel before breaking out, generally downwards with the trend line. The rules are the same for an ascending triangle: if it fails to break, it will go in the opposite direction.
Wedges
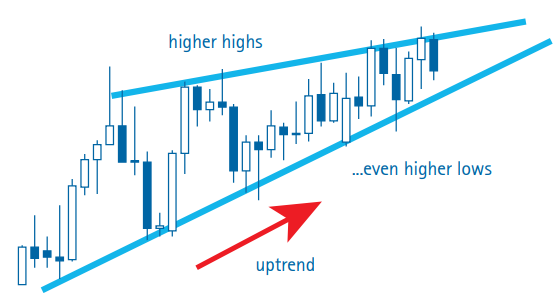
1. Rising Wedge
Wedges are formed by two trendlines converging over time. In the event of a rising wedge which generally occurs during an upward trend, it suggests that a breakout in the opposite direction might be in the works. As the pair start to converge and hit higher highs and higher lows, it means a breakout is nearing. Upon touching the trend line and breaking through it, it will rapidly move in either direction depending on market sentiment.
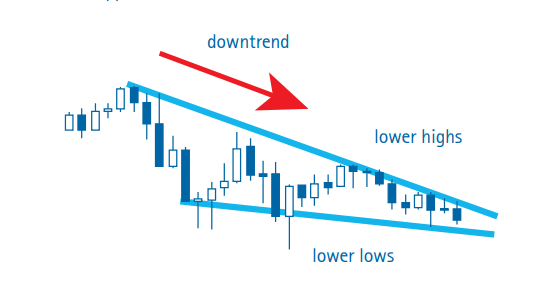
2. Falling Wedge
Falling wedges work in the same way as rising wedges, except that it is no longer about higher highs and higher lows. Instead, we see lower highs and lower lows. As the two trend lines converge to a point and the candlesticks get squeezed between them, the market looks to breakout in either direction. Generally a reversal, this can turn out to be the opposite, hence traders tend to use limit orders to catch the movements.
Conclusion
Technical analysis, through the understanding of patterns and chart techniques, is extremely important in determining the trends in a volatile market. However, this must be combined with the knowledge and understanding of current market news and the fundamental forces which drive it. Economic announcements, political developments and even natural calamities all have an impact on the market. Having such knowledge will give you an edge in adapting to and profiting from exciting and fast-moving markets such as FX and metals.
We recommend Forex Made Easy, our guide on fundamentals, which would be complementary to your understanding of when technicals do break and why. The ultimate trade is one where fundamentals and technicals combine to offer optimum opportunities.